Drayage prices Belgium, Netherlands and Germany 15% lower than 2022
The container transport rates on road in Benelux and Germany have decreased to a two year low, but still 18% higher than compared to 2020 levels, the year the Covid-19 fueled boom began. The drayage market is following global decreased demand trends without a clear sign to pick up soon. This article delves into all transports executed on the UTURN platform in Netherlands, Belgium and Germany and shares all its pricing secrets.
Price trends across countries
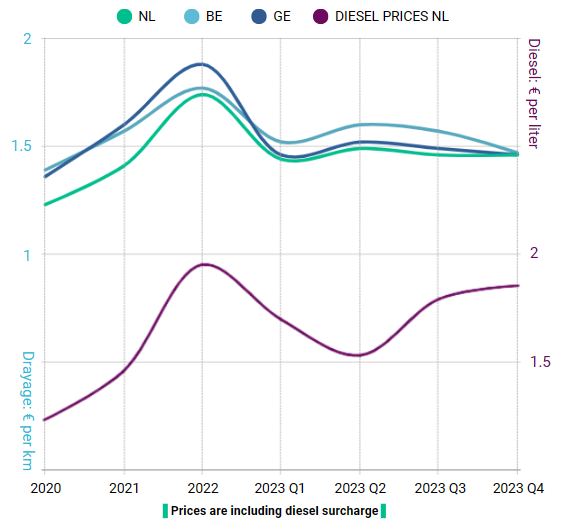
Figure 1. Drayage km price per country
The average kilometer price including diesel of export and import shipments have decreased for all countries around the last turn of the year and have normalized around 2021 levels. This is noteworthy considering the increases we have seen of all major cost drivers, including wages, general inflation and diesel prices. Compared to 2021, the diesel price has increased with 18%, while all-in transport prices remained unchanged. Belgium seemed to have experienced a softer drop in 2023, however this seamed to be more effected by increased road taxations for trucks opposed to a higher demand. As per the first of December Germany has introduced the new toll increases, this is expected to increase all-in prices with around 8% towards next year.
Popular drayage routes
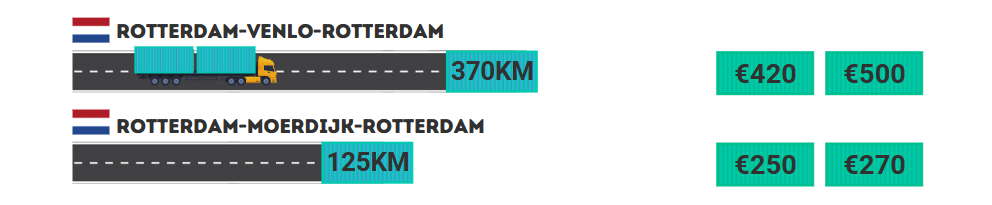
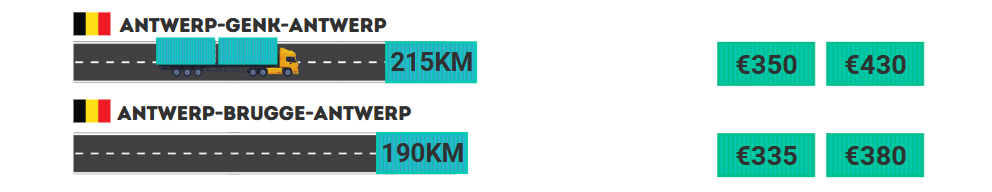
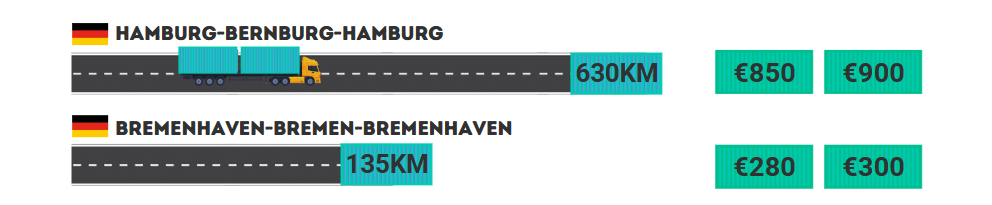
Kilometer prices are perfect to show trends over longer periods however they decrease over longer distances and can be hard to interpret correctly. For this reason we have analyzed lanes that are commonly used. In figure 2 to 4 we show the price range of 50% around the average. This means that 25% of shipments are lower priced than the range and 25% is higher priced then the range. Interested in calculating your own routes? click hereto use the UTURN price calculator.
Figure 2. Popular routes in the Netherlands
Figure 3. Popular routes in Belgium
Figure 4. Popular routes in Germany
How can you influence price?
Target price
Setting a realistic target price significantly influences the outcome of a shipment. Although it may seem strategic to establish extremely low pricing targets, this often proves counterproductive. The most heard reason from transporters to withdraw from quoting are unrealistic target prices. The price calculator can help with determining the current marketprice. Figure 5 shows the percentage above, under and on target price, The majority of shipments get matched either on or above the target set by the shipper.
Figure 5. Percentage matched on target price
Publish and pick-up time
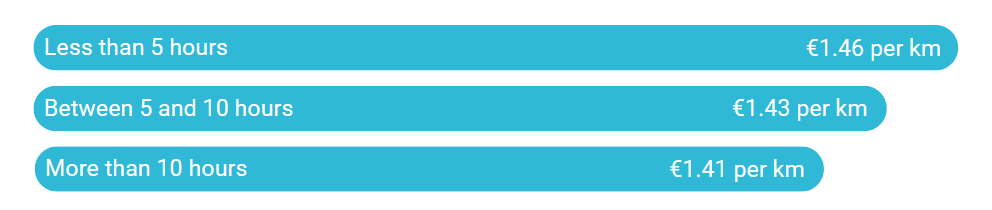
Additionally the lead time between publishing and execution has impact on the price. Figure 6 shows the lead time and corresponding average prices. The message is simple, when you can give a carrier more time in there planning it results in a better price.
Figure 6. Price difference between publish and pick-up time
Interested to learn more about UTURN? Click hereto leave your e-mail.
We use cookies on our website to provide you with the most relevant experience by remembering your preferences and repeated visits. By clicking "Accept All", you consent to the use of ALL cookies. However, you can go to "Cookie Settings" to give controlled consent.
This website uses cookies to improve your experience while you navigate through the website. Out of these, the cookies that are categorized as necessary are stored on your browser as they are essential for the working of basic functionalities of the website. We also use third-party cookies that help us analyze and understand how you use this website. These cookies will be stored in your browser only with your consent. You also have the option to opt-out of these cookies. But opting out of some of these cookies may affect your browsing experience.
Necessary cookies are absolutely essential for the website to function properly. These cookies ensure basic functionalities and security features of the website, anonymously.
Cookie
Duration
Description
cookielawinfo-checkbox-analytics
This cookie is set by GDPR Cookie Consent plugin. The cookie is used to store the user consent for the cookies in the category "Analytics".
cookielawinfo-checkbox-functional
The cookie is set by GDPR cookie consent to record the user consent for the cookies in the category "Functional".
cookielawinfo-checkbox-necessary
This cookie is set by GDPR Cookie Consent plugin. The cookies is used to store the user consent for the cookies in the category "Necessary".
cookielawinfo-checkbox-others
This cookie is set by GDPR Cookie Consent plugin. The cookie is used to store the user consent for the cookies in the category "Other.
cookielawinfo-checkbox-performance
This cookie is set by GDPR Cookie Consent plugin. The cookie is used to store the user consent for the cookies in the category "Performance".
viewed_cookie_policy
The cookie is set by the GDPR Cookie Consent plugin and is used to store whether or not user has consented to the use of cookies. It does not store any personal data.
Functional cookies help to perform certain functionalities like sharing the content of the website on social media platforms, collect feedbacks, and other third-party features.
Performance cookies are used to understand and analyze the key performance indexes of the website which helps in delivering a better user experience for the visitors.
Analytical cookies are used to understand how visitors interact with the website. These cookies help provide information on metrics the number of visitors, bounce rate, traffic source, etc.
Advertisement cookies are used to provide visitors with relevant ads and marketing campaigns. These cookies track visitors across websites and collect information to provide customized ads.